As an affiliate, you are able to monitor how well your promotions are performing by comparing banner statistics in the banner report. You are able to run reports to monitor which creative are converting the best for you. You are also able to monitor the same creative for different marketing channels and URLs by running a banner report.
HOW DO YOU GET THERE?
Reports > Banner Report
HOW DOES IT WORK?
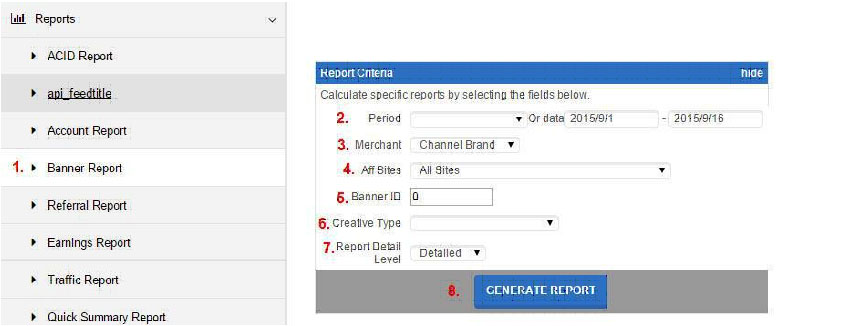
- Go to Reports > Banner Report
- Select the time Period
- By default it will be set to month to date.
- You can choose from one of the past 12 months from the drop down menu.
- Select the
- Select the Site
- By all sites or by a specific site.
- Add the Banner ID (If applicable).
- The banner ID can be found in the btag in your tracking codes. You can also get this information when doing a banner search.
- Select the Creative Type.
- Select the Report Detail Level.
- Detailed will give you a product breakdown.
- Simple will not give you a product breakdown.
- Click on Generate
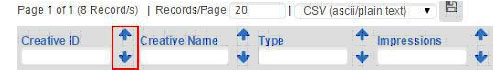
The report is broken down by creative ID (unique id associated to a creative), followed by creative name and type.
You are able to filter the report in four different ways:
- Change the records/page # to view more or all data on one page:

- View in ascending order/A-Z or descending order /Z-A by clicking on arrows in the column header:
- Entering Values. You can have the value be equal to (=), great(>), or less than (<):
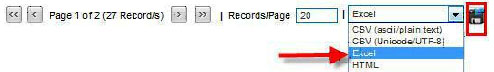
- You can then export this report to a CSV, HTML, XML or Excel spreadsheet for offline viewing by selecting one of them from the list can clicking on the ‘Save’ disk icon.